I was configuring a build with TeamCity (for SpecFlow that is hosted on github). After the initial success, I thought I would also enable code coverage in the build. I don’t really believe in code coverage numbers, but if it is easy (and free) to configure, than why not?
TeamCity supports NCover and PartCover out of the box. As I wanted to go for a free solution (SpecFlow is a free, open-source product), I used PartCover (v4.0.10801). PartCover seems to be a great tool, but it is not so easy to set it up with TeamCity. (You can find a lot of questions and discussions about it.) As I can see, there are some improvements in the later versions of PartCover and TeamCity, but still there are some problems.
If you just start with the build server configuration, you should read first Jeremy Skinner’s post. (On TeamCity 5.1, you don’t have to worry with the assembly renaming.) The rest comes here:
Problem: Sometimes you see no results at all
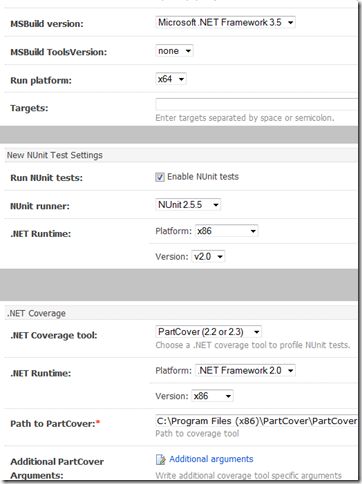
Maybe there are many reasons that can cause this, but for me the problem was an x86/x64 issue. On an x64 build controller, you have to make sure that the test execution and the coverage are all running with the same processor architecture. I’ve achieved success with x86 compilation only, with x64 I always encountered a “…\tmpE1BE.tmp exited with code -1” error. But I did not play with this so much. These are my working settings:
Problem: The reports provided with PartCover don’t work with TeamCity
You can find fixes for the reports in stackoverflow and also on Jeremy’s post, but altogether these reports are not too detailed, e.g. they don’t go into method level. Without knowing which method causes the low class coverage, the numbers are not too helpful (except for your boss). So this leads me to the third problem…
Problem: There is no detailed HTML report available
As I have mentioned above, this was quite a pain for me. So I refreshed my old XSLT skills (again) and tried to put together a report that shows what I need:
- global & assembly-level summary
- top 10 uncovered method
- detailed method-level report with source code line numbers (it is not possible to embed the source code file from XSLT unfortunately)
- coverage values excluding the very simple members (simple property get/set, empty constructor, etc.)
The detailed report (for a small solution): 
Class details with method-level numbers:
How to setup the detailed report
- download the XSLT from here: PartCoverFullReport.xslt
- copy the XSLT file in the “xslt” folder of PartCover on the build controller(s) (e.g.: C:\Program Files\PartCover\PartCover .NET 4.0\xslt)
- in the build configuration, specify the “Report XSLT” field as:C:\Program Files\PartCover\PartCover .NET 4.0\xslt\PartCoverFullReport.xslt=>index.html

9 thoughts on “Detailed Report for PartCover in TeamCity 5.1”